Breaking News


Popular News


Technical analysis for everyone. Improve your trading performance.
Technical analysis for everyone. Improve your trading performance.

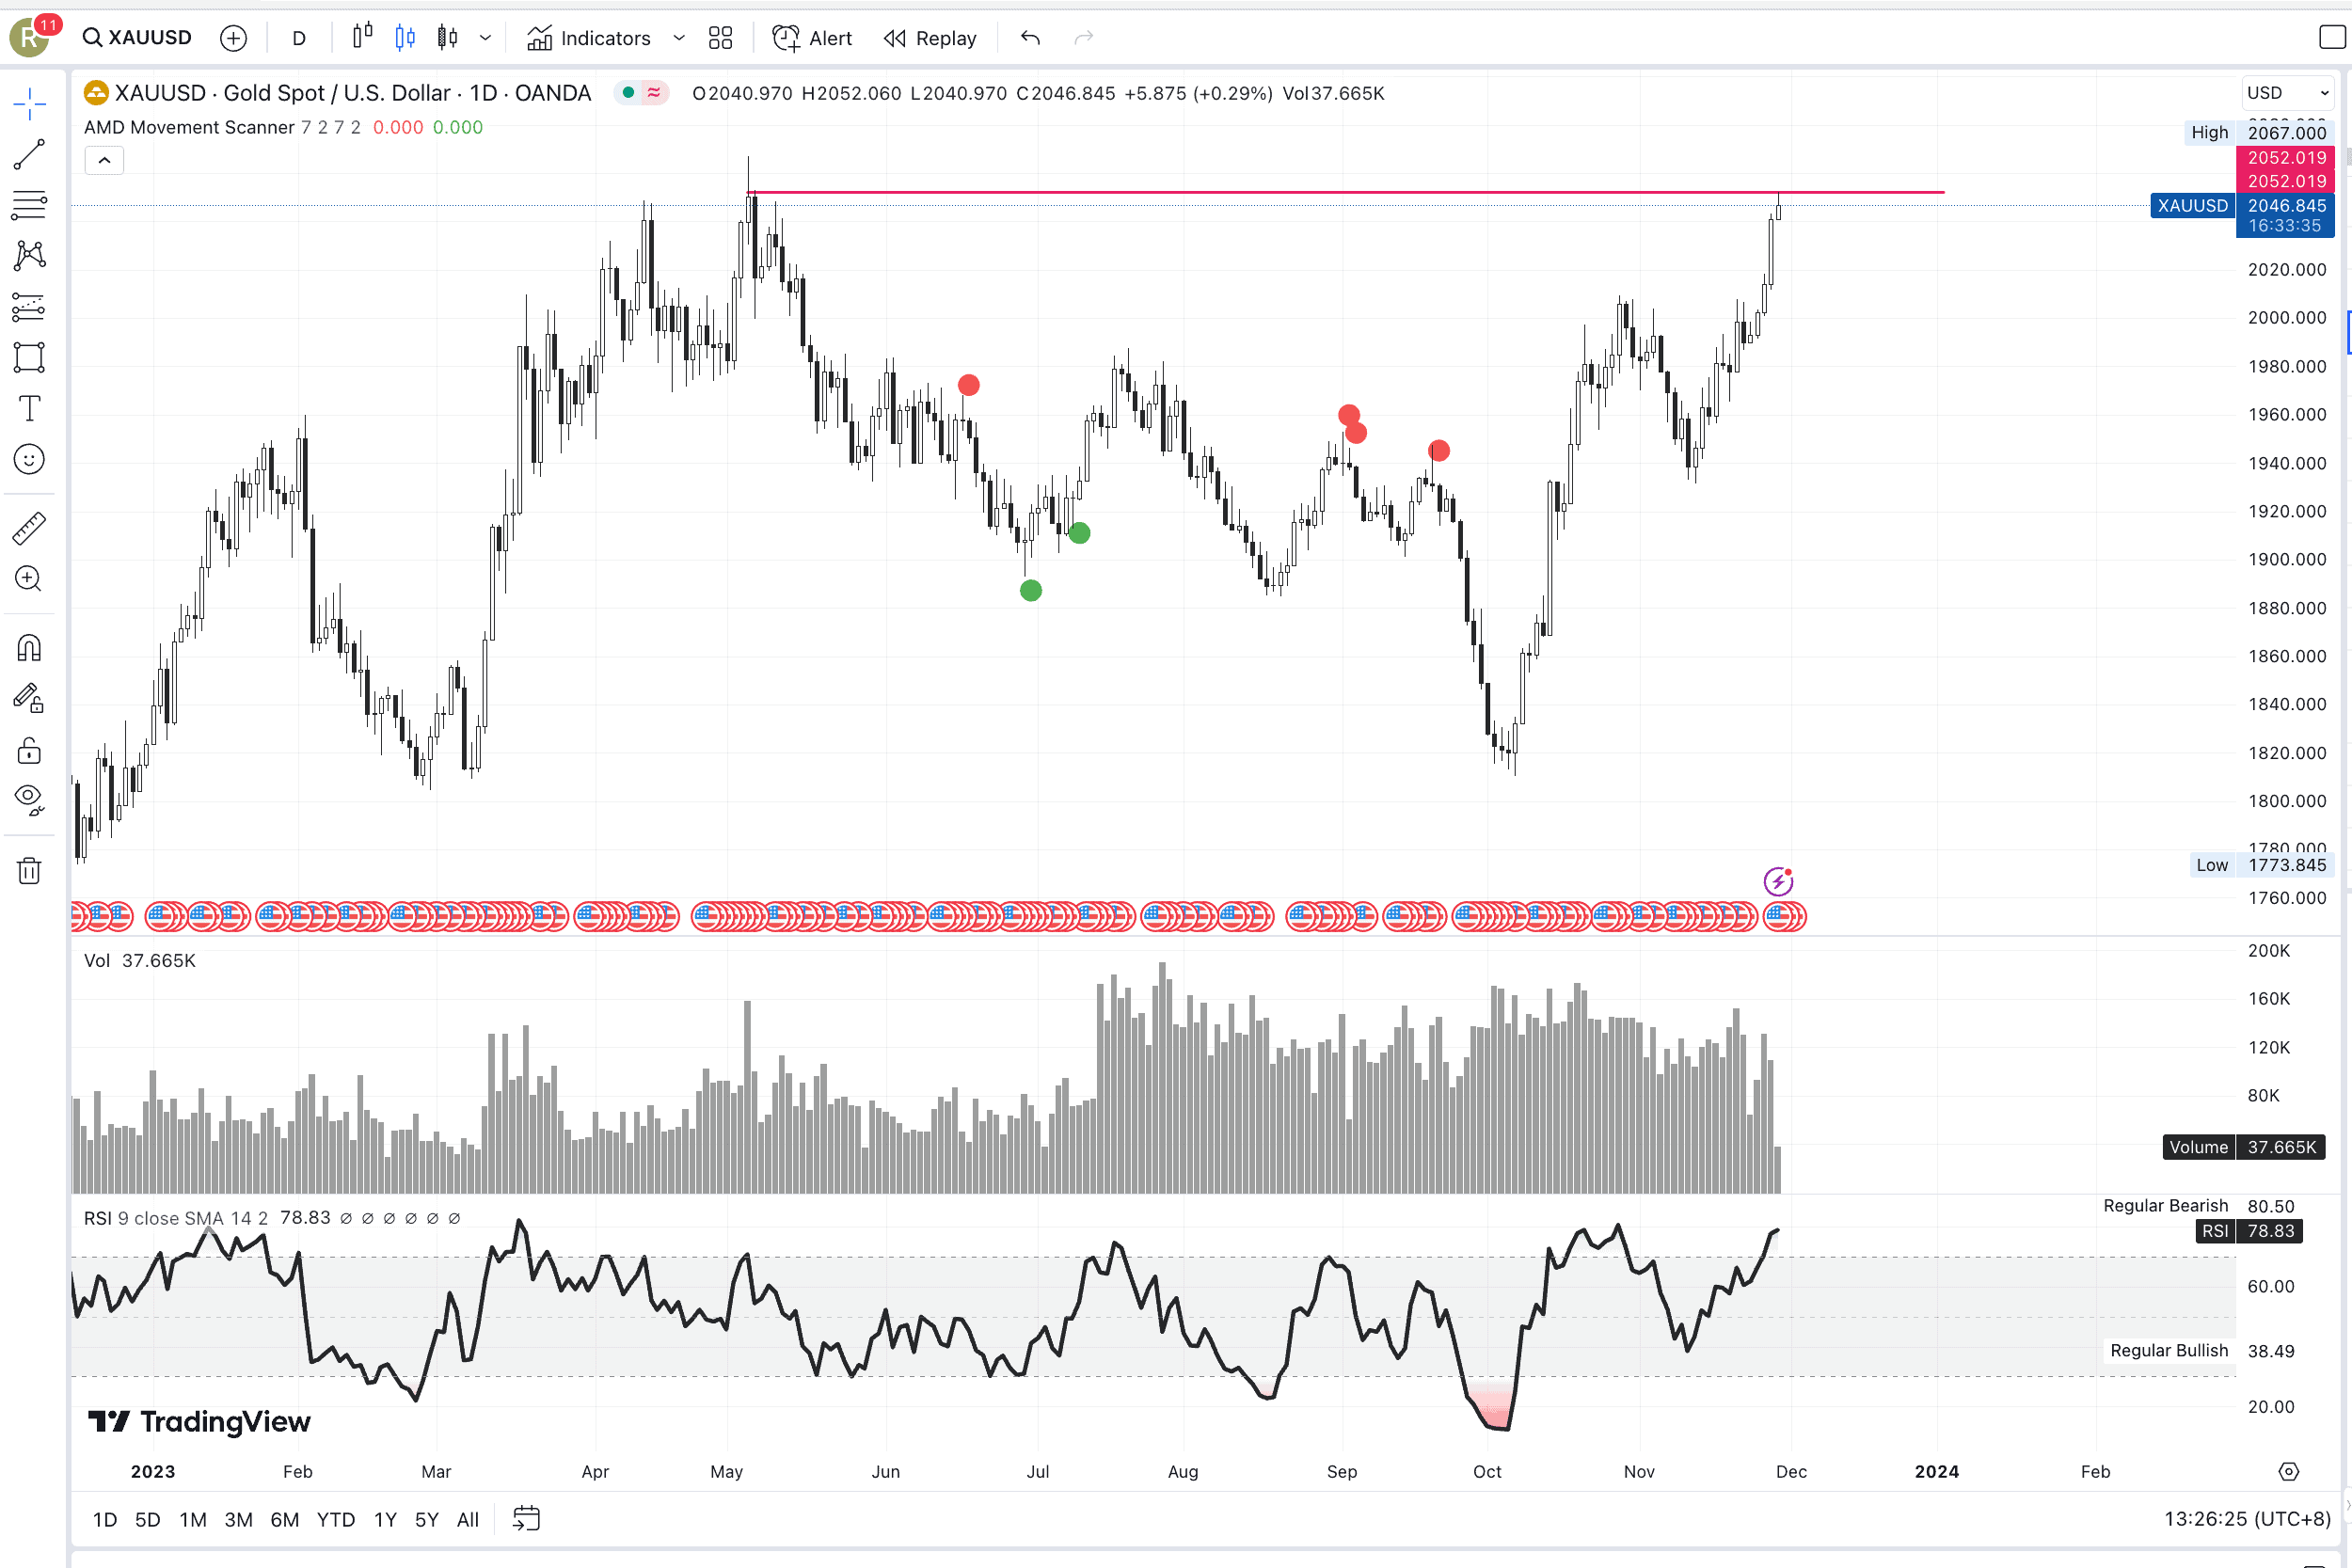
So yesterday, Tuesday, Gold broke the 2020 level and stayed there! It touched 2043 and today reached a new high of 2052. What we want to know is will this precious metal turn around and start to go down?
My analysis below.
The 1D view message is very clear: 2052 is a price level that has acted as a strong resistance. Gold was never able to stay above this price level for more than 2 sessions. Momentum reading shows we will get a pullback after a strong overbought condition. The last time it reached 2052, momentum dropped all the way to oversold over the next ten days. But the current direction is up. Remember: Don’t fight the trend.
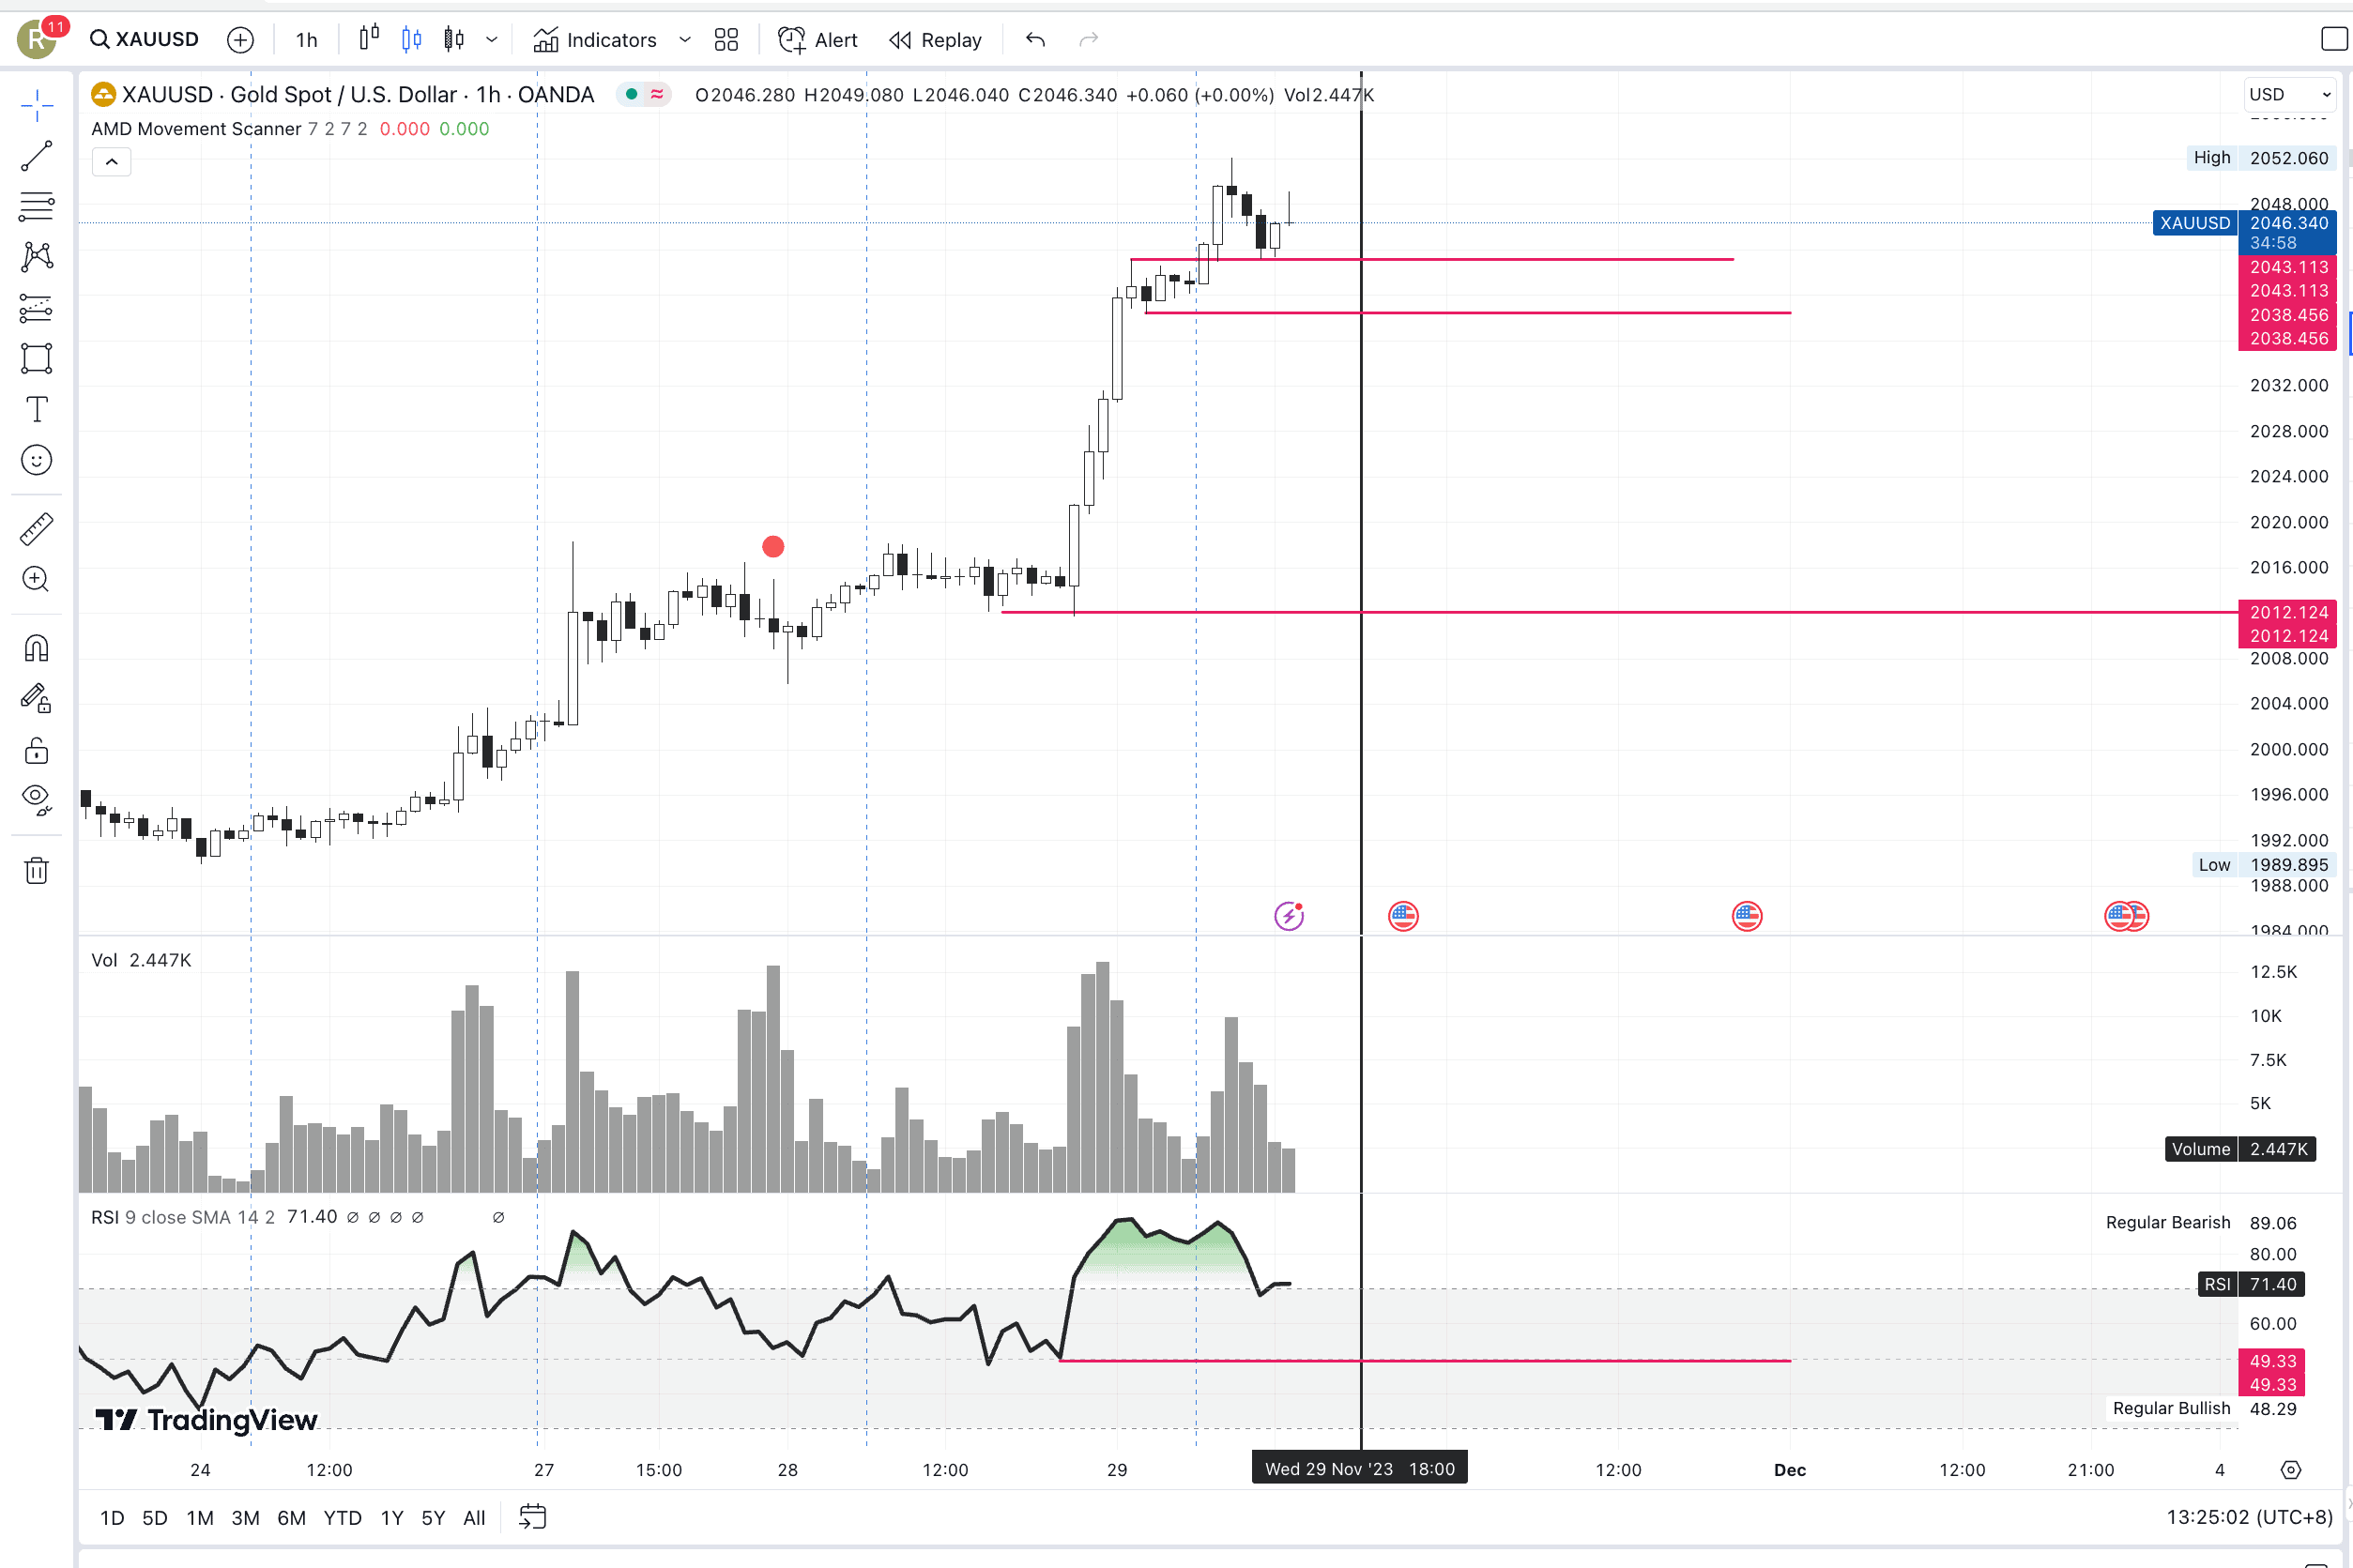
1H view: Knowing the trend is on the way up means we want to see positive price action and momentum in the 1H view. Yes price is going up and yes momentum is in oversold area. So let’s go all-in and make the BUY trade?! Noooo. Of course, not! Prices will always move from area of strength to weakness and vice versa. To make money from trading, on an uptrend that is expected to continue means you want price to move from weakness to strength. Are we getting that now? Unfortunately, not. We have to wait like at the airport. Wait for the plane to come down and land. What is the best price? That really depends on how much risk you want to take. But as a general indication, we see that there is support on the momentum chart at 49 percent RSI. So what could be useful is to wait for momentum to return to this level and then start to move back up.
Momentum will not stay in oversold forever. It will retrace and create a more high probability opportunity for patient traders.